利用numpy和matplotlib绘制稀土元素蛛网图
利用python可以很好地绘制蛛网图图件,这里用Sun and McDonough,1985年的标准数值,对存在txt文件中的样品数据进行标准化,然后,绘制对数坐标系下的蛛网图,其中数据为二维数组,每一列为一个元素的测量值,每一行为一个样品的不同元素含量(ppm)
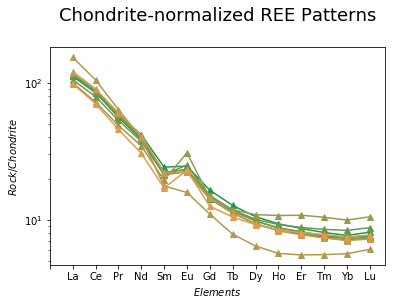
# -*- coding:utf-8 -*-
#地球化学稀土元素蛛网图——球粒陨石模型(Sun and McDonough,1985)
#胡懿灵,2018

import numpy as np
import matplotlib.pyplot as plt
x = np.arange(1,15,1)
x1 = np.arange(0,15,1)
std_element_names = (' ','La', 'Ce', 'Pr','Nd','Sm','Eu','Gd','Tb', 'Dy', 'Ho', 'Er', 'Tm', 'Yb', 'Lu')
std_element_values = np.array([0.237, 0.612, 0.095 ,0.467 ,0.153 ,0.058 ,0.2055 ,0.0374, 0.254, 0.0566, 0.1655, 0.0255,  0.17, 0.0254])
#样品数据处理
data = np.loadtxt('REE_data.txt')
number = data.shape[1]
color_r = np.linspace(0.1,0.9,number)
color_g = np.linspace(0.1,0.5,number)
color_b = np.linspace(0.1,0.3,number)
numbers = np.arange(1,number+1,1)
sample_values = np.zeros(shape=(14,number))
for num in numbers:
    sample_values[:,num-1] = data[:,num-1]
sample_values_stded = np.zeros(shape=(14,number))
for num in numbers:
    sample_values_stded[:,num-1] = sample_values[:,num-1]/std_element_values
wodetian = np.log10(sample_values_stded)
print(wodetian)
#纵坐标为对数
for num in numbers:
    plt.semilogy(x, sample_values_stded[:,num-1], '^-',color = (color_r[num-1],0.6,0.3))
    plt.xlabel('$Elements$',fontsize = 10)
plt.ylabel('$Rock/Chondrite$',fontsize = 10)
plt.xticks(range(len(x1)), std_element_names)
plt.title('Chondrite-normalized REE Patterns\n ',fontsize=18)
plt.savefig("Chondrite-normalized REE Patterns_Sun and McDonough_1985.svg")
plt.show()
结果如下图咯: